Automate Due Diligence Using AI in Private Equity/Investments Firms

The Issues in the Current Due Diligence Process
Making critical investment decisions without a comprehensive due diligence process can lead to costly risks and missed opportunities. Manual due diligence is time-consuming, resource-intensive, and prone to human errors, hindering timely decision-making and affecting investment outcomes. AI in private equity facilitated by ZBrain enhances the due diligence process in private equity and investment firms by automating and enhancing critical tasks.
I. How ZBrain Flow Streamlines the Due Diligence Process
By leveraging advanced AI capabilities, ZBrain Flow empowers your team to conduct swift, precise, and data-driven due diligence, enabling you to identify key risks, evaluate opportunities, and make well-informed investment decisions efficiently.
|
Steps |
Without ZBrain Flow |
Time Without ZBrain Flow |
With ZBrain Flow |
|---|---|---|---|
| Data collection and gathering | Manual | ~5 hours | Automated by ZBrain Flow |
| Data analysis | Manual | ~15 hours | Automated by ZBrain Flow |
| Financial performance assessment | Manual | ~10 hours | Automated by ZBrain Flow |
| Risk assessment and compliance check | Manual | ~12 hours | Automated by ZBrain Flow |
| Report generation | Manual | ~8 hours | Automated by ZBrain Flow |
| Report review and finalization | Manual | ~5 hours | Manual |
| Total | ~55 hours | ~3 hours |
II. Necessary Input Data
|
Information Source |
Description |
Recency |
|---|---|---|
| Financial statements (SEC filings, company annual reports) | Comprehensive information about the company’s financial health and profitability. | Last fiscal year |
| Market data (financial databases, stock market feeds) | Data on share prices, trading volumes, and indices to understand company’s market performance and positioning. | Real-time or as required |
| Economic indicators (government publications, economic research institutions) | Information on economic conditions like GDP growth rate, inflation rate, unemployment rate, consumer sentiment index, etc. | Latest published data |
| Industry-specific metrics (company reports, industry-specific databases) | Depending on the industry, certain metrics may be particularly important like user growth, churn rate, average revenue per user in the software industry. | Latest published metrics |
| Competitor data (competitors’ market research report) | Information about a company’s competitors can provide context for understanding its performance. | Latest published data |
| Regulatory information (regulatory agencies, legal databases) | Data about the regulatory environment, including information about compliance, fines, and changing regulations. | As published |
| Macroeconomic data (government publications, financial news sources) | Macro trends, such as interest rates, exchange rates, and political conditions. | Latest published data |
| Credit ratings (Moody’s, Standard & Poor’s, Fitch) | Credit ratings providing insights into the company’s creditworthiness and financial stability. | Last published rating |
| Management and governance information (company reports, business news) | Information about the company’s management team, board of directors, governance structure, and any changes in these areas. | As published |
III. ZBrain Flow: How It Works

Step 1: Data Collection and Exploratory Data Analysis (EDA)
ZBrain streamlines the data collection process by automatically gathering relevant information for due diligence. This includes financial records, company performance metrics, market trends, industry benchmarks, and regulatory data.
Once the data is collected, ZBrain performs an automated Exploratory Data Analysis (EDA). The EDA phase involves identifying data patterns, detecting outliers, and assessing data quality. ZBrain’s advanced algorithms quickly process the data, ensuring a comprehensive understanding of the investment landscape.
Step 2: Embeddings Generation
In this stage, textual data such as financial reports, market analysis, and company profiles are converted into numerical embeddings using sophisticated techniques. These embeddings capture the semantic relationships within the data, enabling ZBrain to retrieve and analyze information efficiently.
The generated embeddings facilitate precise analysis and support ZBrain in generating accurate investment recommendations and risk assessments.
Step 3: User Query and Report Generation
Upon receiving a user’s query regarding potential investments or opportunities, ZBrain fetches the relevant data based on the specific requirements of the due diligence process. This data and the user query are passed through the ZBrain Flow, which applies the data to the designated prompt templates and feeds it into the OpenAI Language Model (LLM) chain.
ZBrain analyzes the data, performs risk assessments, evaluates financial performance, and generates comprehensive due diligence reports. These reports are tailored to meet the specific criteria set by the user and provide valuable insights into potential investments.
Step 4: Output Generation and Parsing
The reports generated by the LLM are parsed thoroughly by ZBrain. Essential information and key findings are extracted precisely, adhering to the desired format and guidelines for the due diligence process. ZBrain expertly structures the parsed data, ensuring critical investment details are accurately represented.
Step 5: Final Output Generation
The final output of the due diligence process is meticulously generated by ZBrain, incorporating all relevant insights, risk assessments, financial analyses, and recommendations. This coherent and organized output makes it readily accessible to stakeholders and decision-makers in private equity/investment firms.
Enhanced Route Optimization for Logistic Success
ZBrain’s route optimization solution significantly empowers logistics companies to improve their delivery efficiency. The automated process slashes the timeframe from 37 hours to a mere 1 hours, leading to cost reductions and elevated service quality. This, in turn, translates to heightened customer satisfaction and improved profitability. Embrace ZBrain today and elevate your logistics operations to new heights.
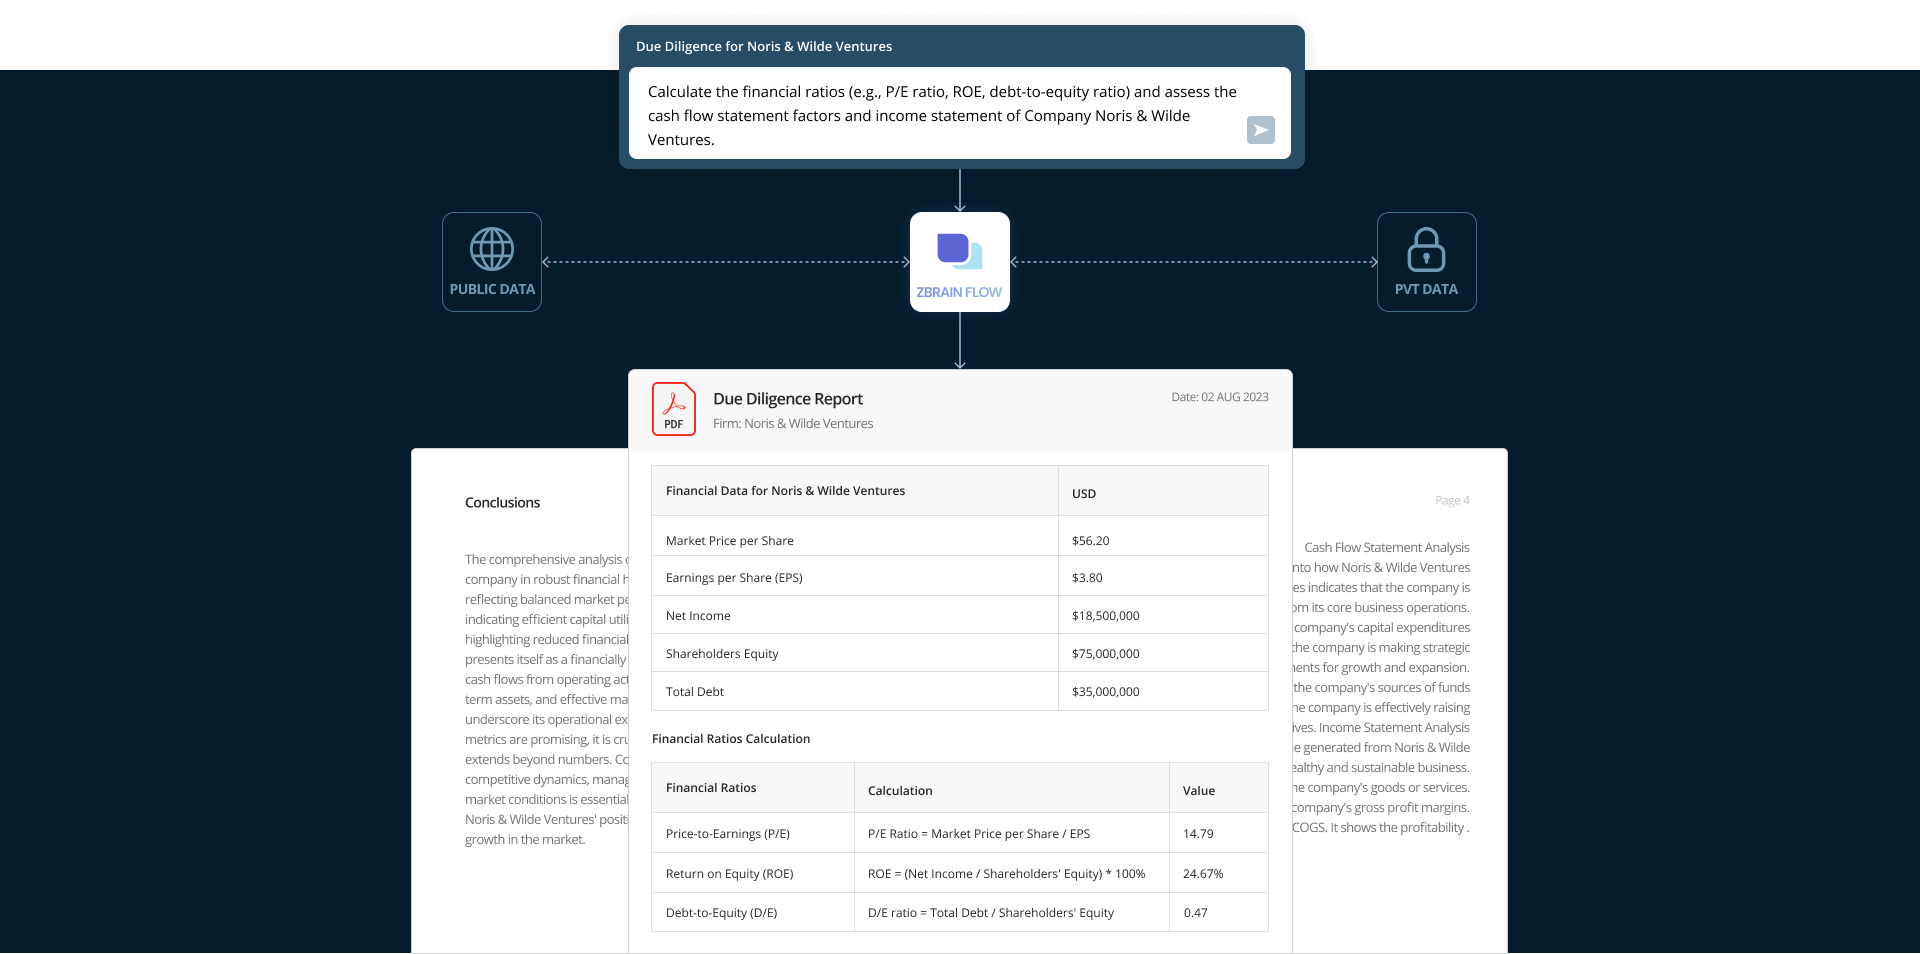
Prompt:
Calculate the financial ratios (e.g., P/E ratio, ROE, debt-to-equity ratio) and assess the cash flow statement factors and income statement of Company Noris & Wilde Ventures.

Financial Data for Noris & Wilde Ventures: (All figures are in USD)
Market Price per Share: $56.20
Earnings per Share (EPS): $3.80
Net Income: $18,500,000
Shareholders’ Equity: $75,000,000
Total Debt: $35,000,000
Financial Ratios Calculation:
- Price-to-Earnings (P/E) Ratio: P/E Ratio = $56.20 / $3.80 = 14.79
- Return on Equity (ROE): ROE = ($18,500,000 / $75,000,000) * 100 = 24.67%
- Debt-to-Equity (D/E) Ratio: D/E Ratio = $35,000,000 / $75,000,000 = 0.47
Cash Flow Statement Analysis
Cash Flow from Operating Activities:
The cash flow statement provides insights into how Noris & Wilde Ventures manages its operating activities effectively. A positive cash flow from operating activities indicates that the company is generating sufficient cash from its core business operations.
Cash Flow from Investing Activities:
The cash flow from investing activities illustrates the company’s capital expenditures and investments in long-term assets. A positive cash flow in this section suggests that the company is making strategic investments for growth and expansion.
Cash Flow from Financing Activities:
The cash flow from financing activities represents the company’s sources of funds from debt and equity financing. A positive cash flow in this category may indicate that the company is effectively raising capital to support its operations and growth initiatives.
Income Statement Analysis
Revenue:
The revenue figure on the income statement represents the total income generated from Noris & Wilde Ventures’ core business activities. Steady revenue growth is a positive indicator of a healthy and sustainable business.
Cost of Goods Sold (COGS):
COGS represents the direct costs associated with producing the company’s goods or services. Effective management of COGS can improve the company’s gross profit margins.
Gross Profit:
Gross profit is the difference between revenue and COGS. It shows the profitability of the company’s core business operations before considering operating expenses.
Operating Expenses:
Operating expenses include all costs related to running the business, such as selling, general, and administrative expenses. Effective control of operating expenses can lead to improved profitability.
Net Income:
Net income is the final profit figure after deducting all expenses, taxes, and interest. Positive net income indicates the company’s ability to generate profits after all costs.
Interpretation of Results:
- The calculated P/E ratio for Noris & Wilde Ventures is 14.79, which indicates that the market is willing to pay approximately 14.79 times the earnings per share for the company’s stock. A moderate P/E ratio suggests a balanced market perception of the company’s growth potential.
- The ROE of 24.67% for Noris & Wilde Ventures indicates that the company efficiently generates profits from its shareholders’ equity. This relatively high ROE implies effective utilization of capital, which could be favorable for potential investors.
- The D/E ratio of 0.47 suggests that Noris & Wilde Ventures maintains a conservative capital structure with a relatively low level of debt compared to equity. This indicates a reduced level of financial risk and financial leverage.
Cash Flow Statement Analysis:
Noris & Wilde Ventures demonstrates a positive cash flow from operating activities, indicating that the company’s core business operations are generating sufficient cash to support its activities. This is a positive sign of strong operational performance.
In the cash flow from investing activities section, the company is making strategic investments in long-term assets, potentially indicating a focus on expansion and innovation.
The cash flow from financing activities indicates that Noris & Wilde Ventures is effectively raising capital through debt and equity financing to support its growth and operational requirements.
Income Statement Analysis:
The revenue growth for Noris & Wilde Ventures reflects a healthy and sustainable business model, with consistent income generation from core activities.
Effective management of the cost of goods sold (COGS) has contributed to healthy gross profit margins, indicating efficiency in production and cost control.
The company’s operating expenses are well-managed, contributing to improved profitability and a positive net income, which is a strong indicator of the company’s financial health.
Important Considerations:
While financial ratios and statement analysis provide valuable insights into Noris & Wilde Ventures’ performance, it is essential to consider additional factors during the due diligence process. These include industry trends, competitive analysis, the evaluation of the management team, and overall market conditions. A comprehensive assessment of these factors will enable a better understanding of the company’s position within the market and its potential for sustained growth.
Please note that the accuracy of the financial ratios and statement analysis relies on the reliability and accuracy of the financial data provided. Additionally, past performance does not guarantee future results; thus, reviewing and updating the analysis regularly is essential.
Conclusion:
The comprehensive analysis of Noris & Wilde Ventures reveals a company in robust financial health. With a moderate P/E ratio reflecting balanced market perception, a commendable ROE indicating efficient capital utilization, and a conservative D/E ratio highlighting reduced financial risk, Noris & Wilde Ventures presents itself as a financially sound entity. Moreover, positive cash flows from operating activities, strategic investments in long-term assets, and effective management of costs and expenses underscore its operational excellence. While these financial metrics are promising, it is crucial to remember that due diligence extends beyond numbers. Considering industry trends, competitive dynamics, management competence, and prevailing market conditions is essential to gain a holistic understanding of Noris & Wilde Ventures’ position and potential for sustained growth in the market.


